Are We Heading for a Blow-off Market Top?
Managers’ Observations on Recent Market Action
In attempting to be a Fair Observer, I’d like to make some observations about the current market environment that could lead any reasonable student of market history to conclude that the market may have evolved into a speculative phase.
As Torsten Slok, Chief Economist at Apollo points out in a recent note, S&P 500 market returns are increasingly narrow. If you had invested $1 million in the S&P 500 on January 1, 2021, your total return today (7/24/2025) would be about $660,000, of which more than half (54%) would have come from the top 10[1] biggest companies (1) in the index, see chart below.
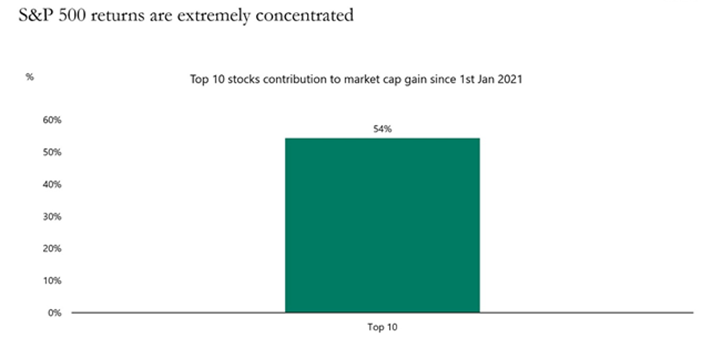
Since COVID, S&P 500 are not diversified but instead remain extremely concentrated in a small group of tech stocks. No doubt AI will continue to have a dramatic impact on all our lives, but the question remains whether Magnificent 7 are correctly priced, and if they will even be the best AI investments over the next five to ten years.
This has led to 83% of active large cap managers underperforming the benchmark S&P 500 over the past 5 years causing a continuing shift into passive index strategies which further drive up the market concentration among the top stocks – particularly the Mag 7. And, those managers who have outperformed have generally accomplished that by increasing the allocation in the top market components, giving them yet more concentration than the benchmark itself. But it’s more than just a narrow market. There has been a notable rise in what a Fair Observer might call speculative activity.
Speculative trading activity fuels narrow-breadth and a short squeeze
An interesting indicator, recently constructed by Goldman Sachs Investment Research, based solely on trading volumes, gives some insight into this activity. Specifically, it is an index of monthly changes in the proportion of US public equity dollar trading value attributable to:
[1] unprofitable stocks, [2] penny stocks, and [3] stocks with EV/sales multiples greater than 10x. During the month of July, the share of trading activity taking place in each of those three groups of stocks has ranked in the top quintile of activity since 1990. A Fair Observer might agree that increased activity in those broad categories might indicate speculative activity.
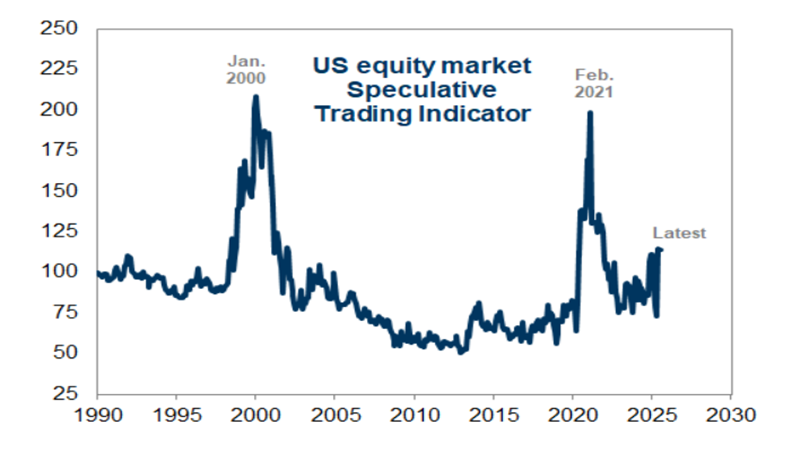
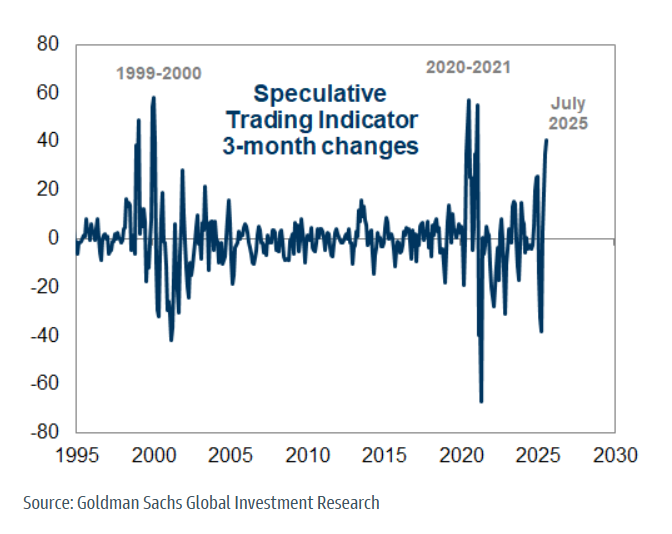
As can be seen below, there has been a dramatic increase in speculative trading volume as defined, while it is still below the peaks of the past as seen in the long-term chart above.
Going beyond the Speculative Trading Indicator, there are other notable signs of speculation present in the current market environment. As we have noted often in our daily notes, valuations don’t seem to matter (until they matter!)
Recent US equity trading volumes have increasingly centered on high-multiple stocks. The median EV/sales multiple of the 50 stocks with the highest share trading volumes, has also surged during the last few months. As of July 25, 2025, that EV/sales multiple equals 8x, the highest level in recent decades outside of 2000 and 2021 according to Ned Davis Research.
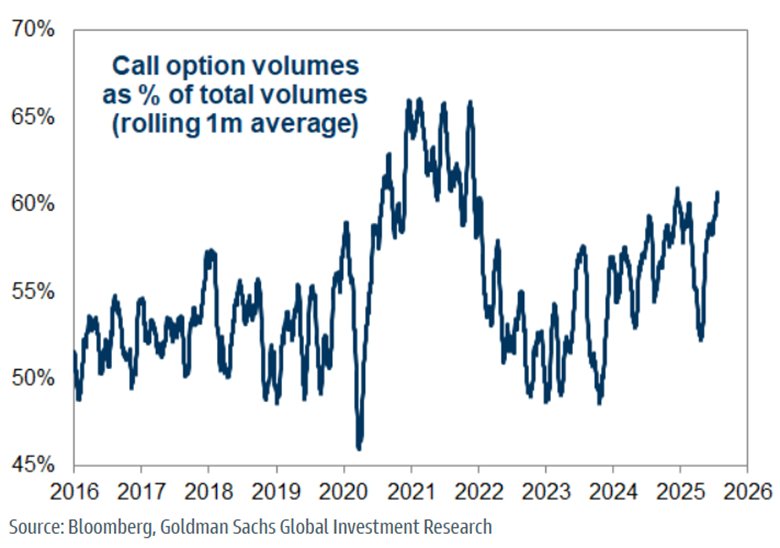
Concurrent with the elevated trading volumes in high-multiple stocks, there is a notable increase in speculative options activity. Call option volumes have surged alongside the increase in "speculative" cash trading volumes. During July, calls have accounted for 61% of option volumes. This compares with a 20-year average of 55% and matches December 2024 as the highest share in a decade outside of the COVID period from summer 2020 through early 2022.
In speaking with several proprietary trading desks, the Fair Observer has been told that there may also be some short squeeze targeting going on as many hedge funds have been off-sides on the current market and have elevated short exposure. Retail investors, using publicly available short interest data, focus social media investors on stocks with high short interest to rally speculative buyers into the stocks therefore creating a “short squeeze” as large funds scramble to cover their short positions.
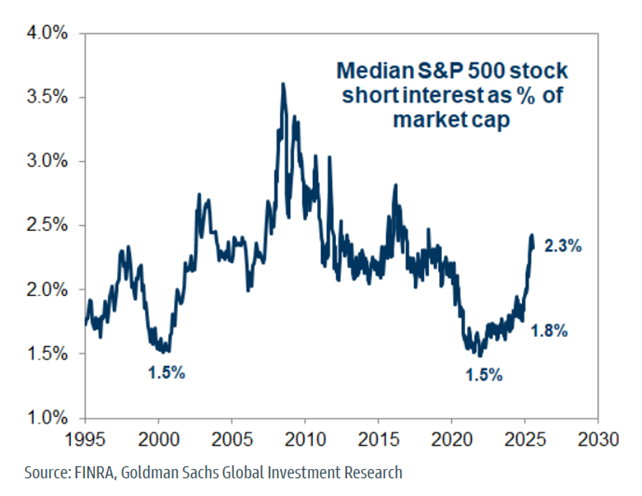
According to SEC and FINRA data, median short interest normally runs at about 1.8% on average, so this is an environment where small companies with high short interest can be easily targeted for a short squeeze.
The SPAC is Back!
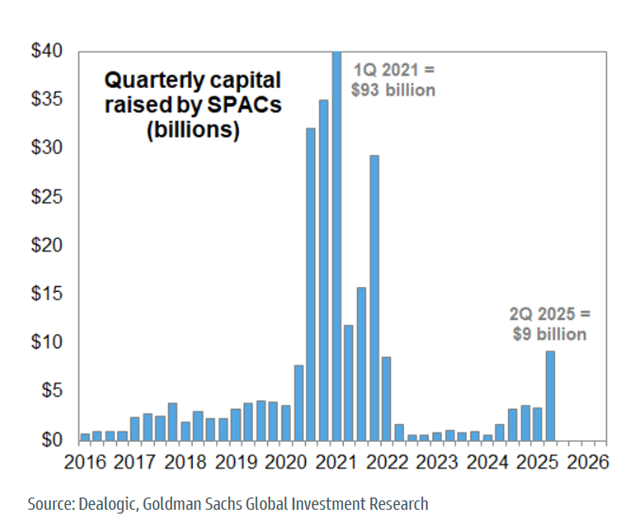
Any Fair Observer of market data will note that when SPAC’s are easily able to raise large pools of capital, it has signaled heightened market speculation. The data suggests that the SPAC is back. SPAC activity has increased dramatically, with 2Q 2025 reflecting the largest quarter for SPAC activity since 1Q 2022. 41 offerings raised a total of $9 billion in the quarter, for a 2025 first half total of $12 billion.
The IPO window has also reopened. This by itself is not necessarily an indicator of speculation. However, when new deals flood the calendar, and first trade price action is explosive, this suggests speculative activity. The median US IPO in June rose by 37% in its first trading day, the best month since early 2024 and a top decile relative to the past 3 decades according to Bloomberg News, with 9% being the long term average.
Take Aways:
What does this suggest for prudent portfolio positioning across the product suite? These positioning dynamics, along with extremely narrow market breadth, are a condition that typically signals risk to intra-market momentum. The Fair Observer has seen this since the start of July, where momentum factor ETF’s and momentum stock baskets have experienced a notable underperformance while our internal models have shown rapidly changing sector rotation. This supports the thesis of faster trading decision making and a more nimble rotational approach to portfolio management.
Market environments that exhibit high levels of speculative activity tend to lower market returns on a longer time horizon according to Mark Leibovit, of the Volume Reversal Survey and long-time friend of the firm. According to Mark, “In the past, sharp increases in speculative trading activity have signaled above-average near-term equity returns but a poor medium-term outlook for stocks.” He defines “sharp increases" as 3-month return of 15% or more, a threshold that reflects roughly the top 5% of observations since 1990, twenty-one of them during the period. These above-average near-term returns have been accompanied by slightly higher near-term volatility and, more often than not, have eventually led to market drawdowns. He is expecting a correction sometime during the back half of the year but remains overall bullish on the market.
July 25, 2025
Rick Imperiale
Writing as The Fair Observer
[1] (1) Note: Top 10 companies are NVIDIA, Microsoft, Apple, Amazon, Alphabet, Meta, Broadcom, Tesla, Berkshire Hathaway, JP Morgan. Sources: Bloomberg, Apollo Chief Economist.